Dashboard
The dashboard page is where you view total summary and statistics across all games recorded and stored on your device. The dashboard includes the following: TIP: The dashboard pages scrolls down so be sure to scroll the page to see all the details.
Games Summary
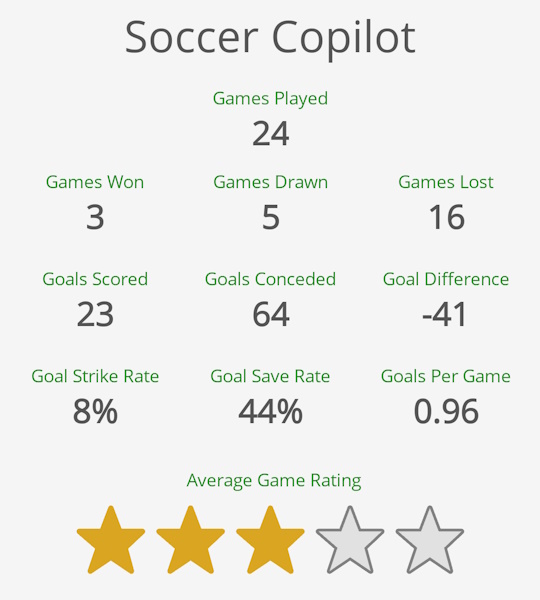
Summary about games played, games won, drawn and lost, total goals scored and goals conceded, goal strike rate, goal save rate and goals per game. Click here to find out more about Goal strike and goal save rate.
Game & Goal Stats

Scrolling down the page, the next details will be two pie charts showing the game summary and goals summary.
The game summary chart is a visual summarising your teams overall game wins, losses and draws percentages.
10 Game Trend

Scrolling further down the page the next visual is the last 10 game winning streak bar chart indicating your trend of games with wins in green, draws in orange and losses in red.
10 Game Possession Trend
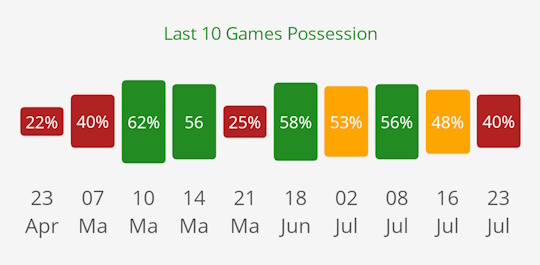
The last section shows the last 10 games played goals scored and goals conceded trend by game.
NOTE: It's important to know that if you record multiple team's games on your profile, then be aware that the dashboard page will show you your summary based on all the games from all the different teams.
There is currently future release in scope to let you choose which teams you want to generate the above listed summaries for on the dashboard page.